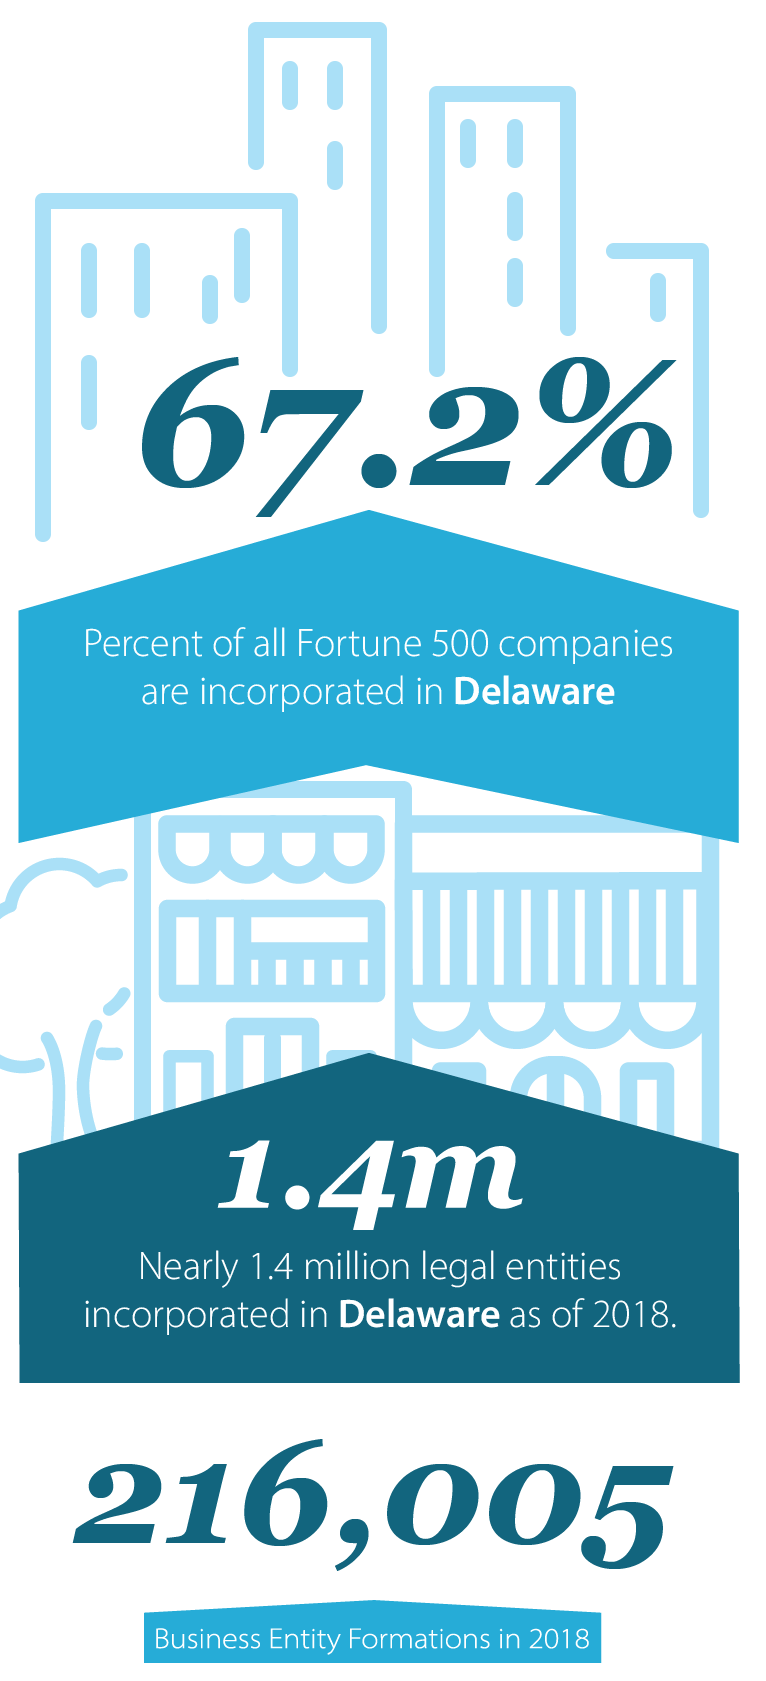
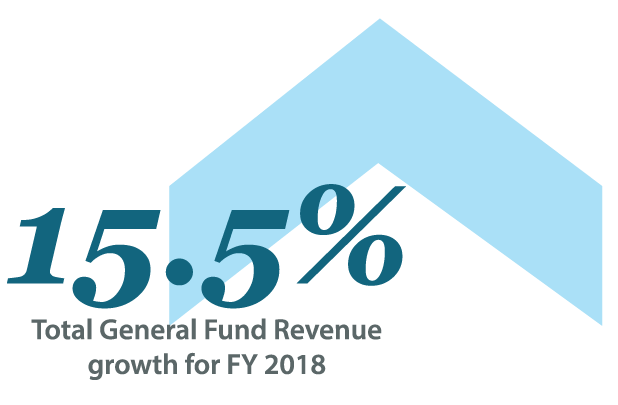
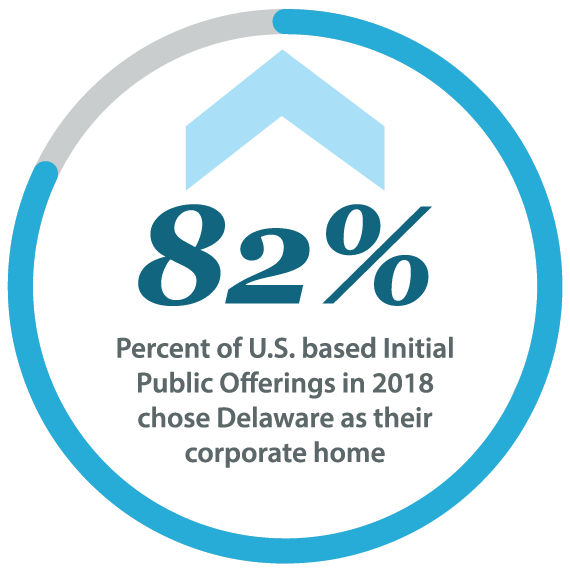
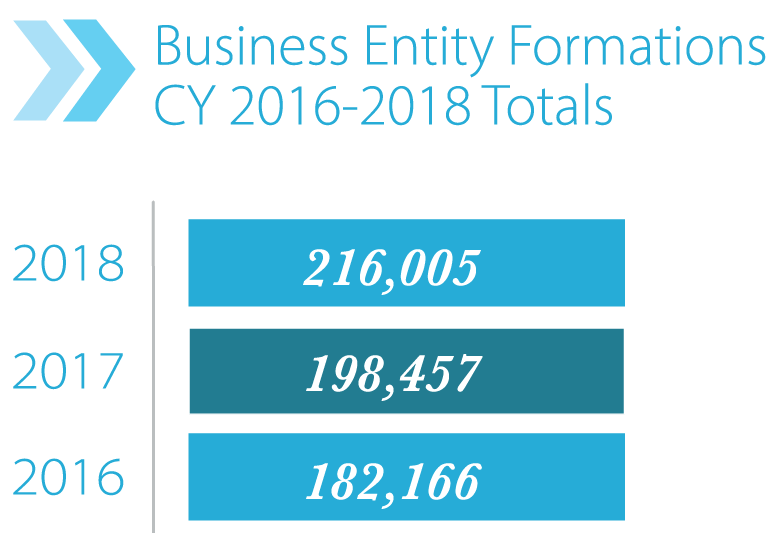
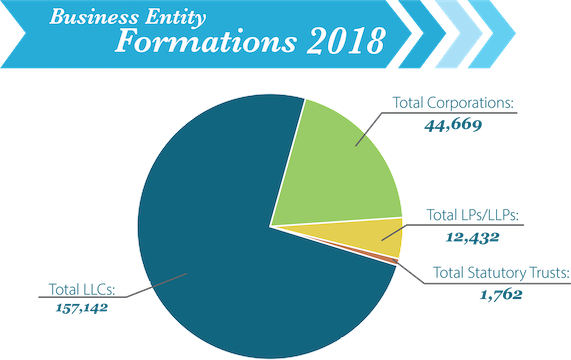
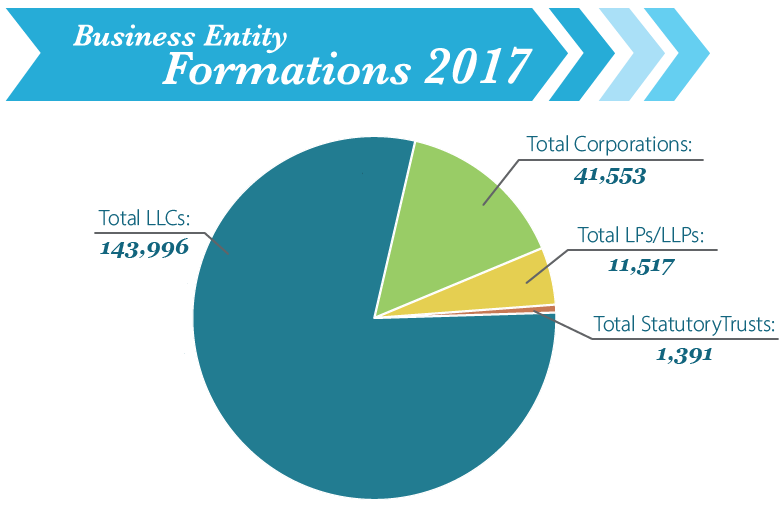
In 2018 Delaware’s corporate franchise continued its pattern of strong growth, adding new corporations and alternative entities to our registry at a near-record pace. Revenues generated from taxes and fees also grew in the previous year, continuing to expand despite a relatively weak IPO market. Delaware remains the home of the vast majority of top U.S. companies, including more than two thirds of the Fortune 500 and 80 percent of all firms that go public.
Updates to the Delaware General Corporation Law and alternative entity statutes enacted in 2018 introduced new tools that allow businesses greater flexibility in formation and organization. Notable examples include new provisions governing series LLCs and entity divisions. Policymakers in Delaware continue to recognize and respect the nature of our business entity laws as “living documents” that require revisions and updates annually to ensure that our state remains the worldwide leader in corporate jurisprudence.
In the office of the Secretary of State, 2018 saw renewed efforts to protect Delaware’s franchise and deny access to those who attempt to use Delaware entities for nefarious purposes. In cooperation with the legal community and the business services industry, we crafted "Know Your Customer" regulations that require new business entities formed in Delaware to be screened against lists of persons and groups that have been prohibited from doing business in the United States. In addition, the new regulations mandated that Delaware registered agents check their lists of existing clients, associated contacts and entities against these lists on a quarterly basis. The Division of Corporations also has greater latitude to refuse to process filings from a registered agent that fails to obey regulations. Combined with the diligent efforts of our business services community, these new regulations will help keep bad actors from making their legal homes in Delaware.
Additional legislative amendments passed in 2018 granted broader authority to the Delaware Attorney General to petition the Court of Chancery for the cancellation or dissolution of entities that have been associated with criminal activity. We worked in close collaboration with the Attorney General in drafting and securing approval of these new powers, which will serve as another tool to weed out entities that do harm to the public and bruise our state’s reputation.
In Washington, we continued to advocate in favor of federal action to make beneficial ownership information available to law enforcement, which will aid in combatting illicit financial activities such as money laundering and the funding of terrorism. This is a 50-state issue that requires a 50-state solution, avoiding the loopholes and inconsistencies that would arise from a state-by-state approach. We remain committed to working with Congress to make meaningful progress.
At home in Delaware, I’m proud to say that our Division of Corporations and the team of professionals who comprise it continue to operate at the highest levels of customer service and responsiveness. I never cease to be impressed by their dedication, and the frequent compliments and positive feedback I receive from across the business entity world certainly are well-deserved.